Determining user behavior is a key element in the development and success of the data-driven design.
UI/UX developers can use user behavior identifiers for anything from analytics to statistics, data protection, and user interface development. In contrast, the primary focus of the user behavior analytics tool is to monitor what the user is doing.
Providing insight is the whole purpose of user behavior analytics. At a high level, user behavior analytics helps to understand who users are, what they do, what they need — and most importantly — what we need to do to retain them.
Insights from user behavior analytics allow for a better data-driven design that helps to create a user-centric design and a better user experience. It enables you to make better design choices based on real evidence about your behavior, attitude, needs, etc. That helping to improve the KPIs that drive business, make more effective decisions, and transform results.
One important difference between different types of tools concerns whether they (primarily) provide answers to user thinking and behavior regarding why or what. You could relate to this as a difference akin to qualitative and quantitative, or thick and big data. The important thing is that the perspectives are complementary. As a UI/UX designer, you must descend from what to why; To advance your designs further through the data collecting from user behavior tools.
1- User screencasts and recordings
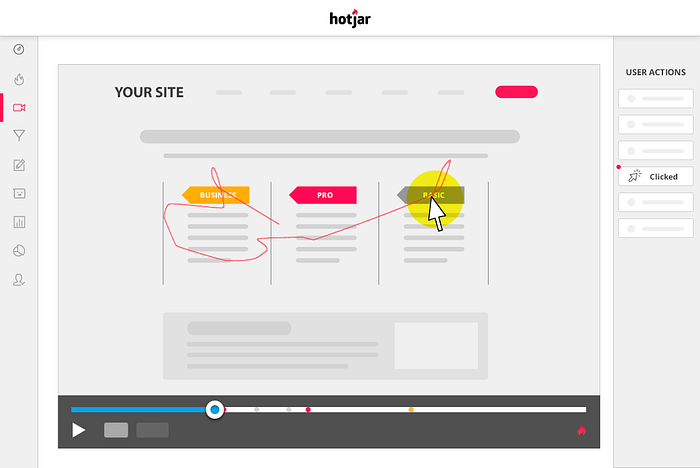
Session replays offered through screen recordings provide a very detailed view of user activities and even intentions. This is important because usability tests are often the most informative when showing what users failed to achieve. Screen recordings can be much more valuable for UI designers than all other types of tools, but they work best in combination with other methods. At the same time.
Here are the best tools for user screencasts.
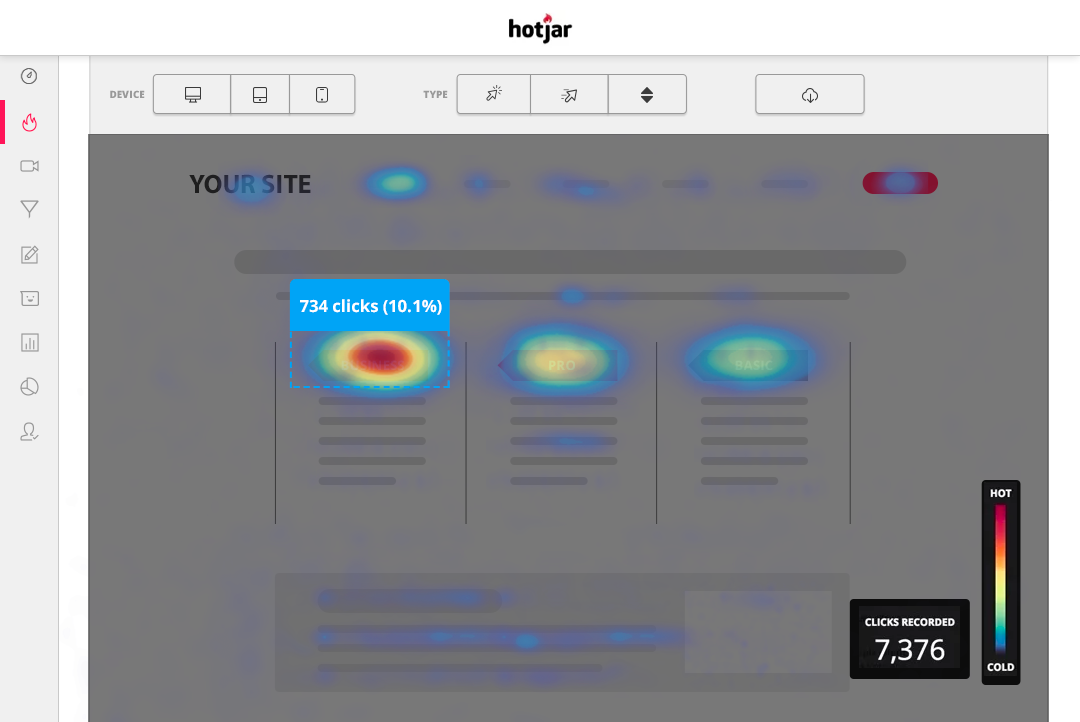
2. Heat maps
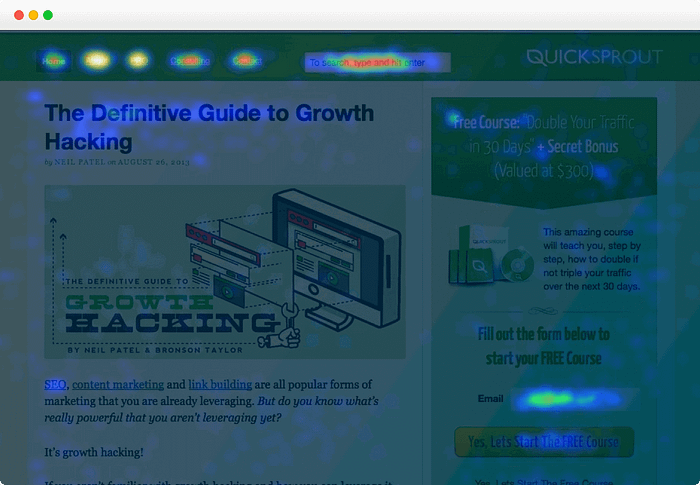
Nobody will click on targets they do not perceive. So heat maps are one of the most popular techniques to reveal how users interact with clicking. They display the amount of clicks users make on a website.
Here are the best tools for heat maps.
3. Experiment management
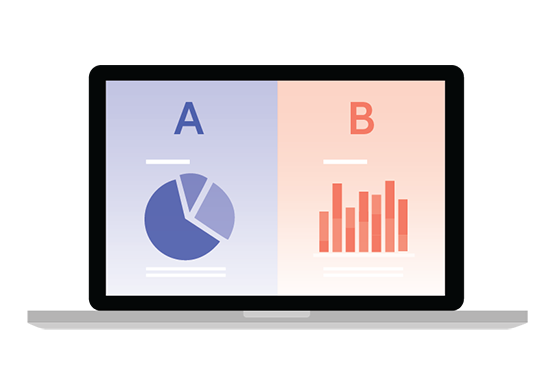
Experiment management enables the running of different types of experiments on digital services. Most famous of them all, AB or ABX tests that pit multiple design variations against one another. AB refers to a simple comparison of two designs (one of them usually being the old, control version), whereas the ABX test includes several variations, sometimes in multiple dimensions.